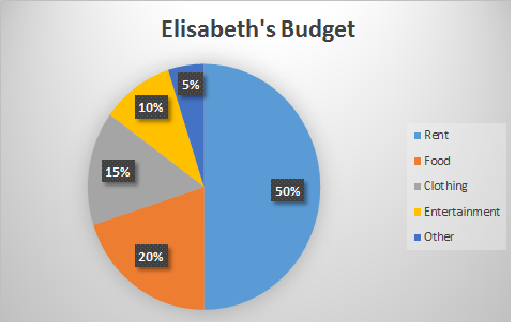
Elisabeth spends the largest portion of her income on ________
The percentage of her income that Elisabeth spends on entertainment and others expenses combined equals what she spends on _________
Elisabth spends 20 % of her budget on ________
Elisabth spends ________ % of her monthly income on clothing.
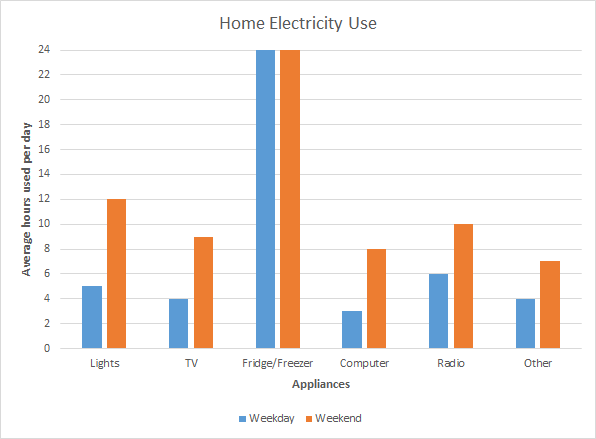
Can you tell what the bar graph measures?- Measures the hours an appliance is used per day.
- Measures the kilowatts an appliance needs per day.
- Measures the hours an appliance is used per year.
- Measures the hours an appliance is used per month.

What does the vertical axis represent?- Days of the week.
- Hours in a day used.
- Amount of electricity used.
- Types of appliances

What is measured by the orange bar?- Weekend: amount of electricity used
- Weekday: hours of use
- Weekend: hours of use
- Weekday: amount of electricity used

How many hours is the computer used on a weekday?- 3
- 4
- 5
- 6

After the fridge/freezer, which appliance is used the most on weekdays?- TV
- Radio
- Computer
- Lights

Which appliances are used for an average of 5 hours a day more on weekends than on weekdays?- Lights and Computer
- TV and Computer
- Radio and Computer
- Other and Computer

Which film has the most viewers?- Frozen is the most popular film.
- Avatar is the most popular film.
- Titanic is the most popular film.
- Avengers: Age of Ultron

In which year did Titanic hit the cinemas?- 1997
- 1996
- 1995
- 1998

How many viewers watched Fast & Furious 7?- approx. 20 Mio. viewers
- Less than 15 Mio viewers
- More than 15 Mio viewers
- Not clear how many viewers

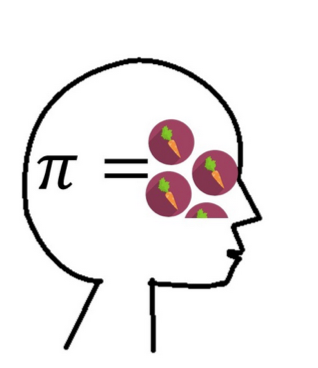
This infographic shows...- ... that Pi is exactly 3,14159...
- ... that Pi is an indefinite number
- ... that Pi is approximatly 3,20
- ... that Pi equals 3 and 1/3 carrots

An infographic is used...